Sherlock - Operation Blackout 2025 - Ghost Thread
Challenge Description: Byte Doctor suspects the attacker used a process injection technique to run malicious code within a legitimate process, leaving minimal traces on the file system. The logs reveal Win32 API calls that hint at a specific injection method used in the attack. Your task is to analyze these logs using a tool called API Monitor to uncover the injection technique and identify which legitimate process was targeted.
Difficulty: Easy
Introduction
During my HackTheBox CDSA learning path, I took the Introduction to digital forensics course and they talked a little bit about the API process monitoring. Basically, the .apmx64 files are generated by API Monitor, which records API call data. These files can be opened and analyzed within the tool itself. API Monitor is a software that captures and displays API calls initiated by applications and services. To start this challenge, we have one IDA database file and a apmx64 file. Let’s open the first one in IDA and the last one in API Monitor.
First investigation
API Monitor
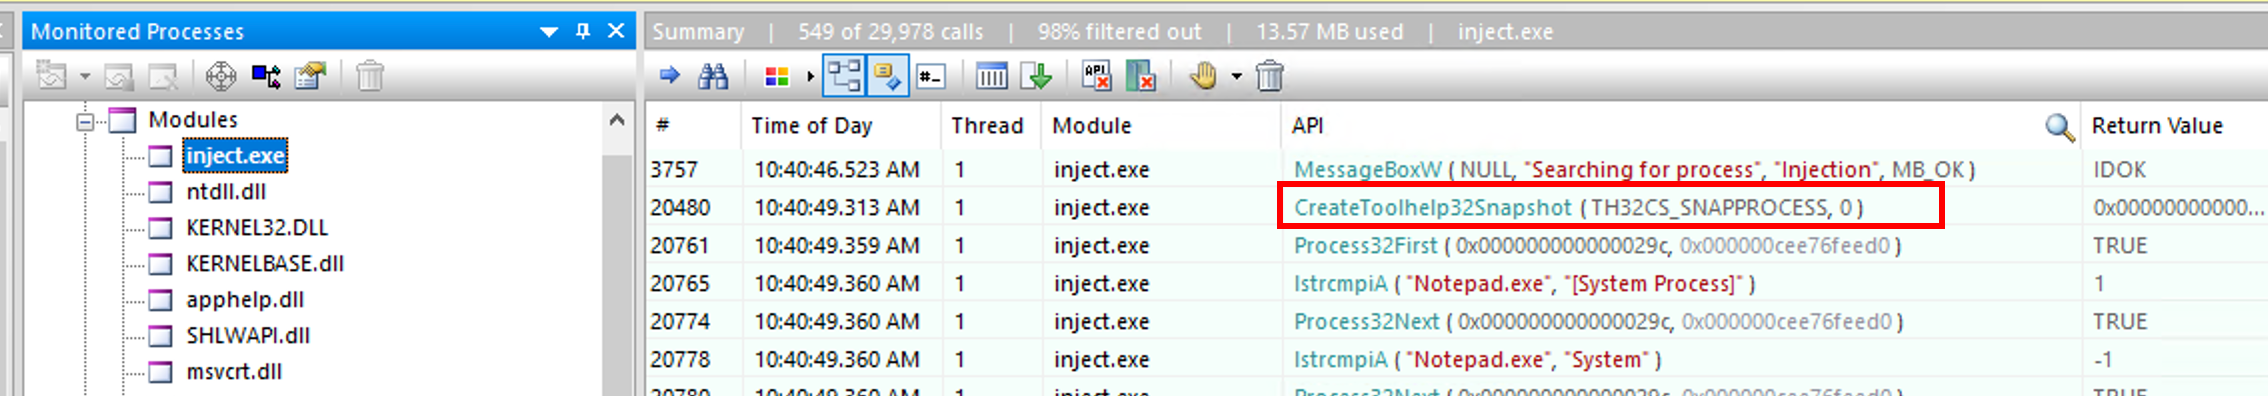
After launching the .apmx64in API Monitor, we can see that the monitored process was inject.exe (PID 8520 at the time.)
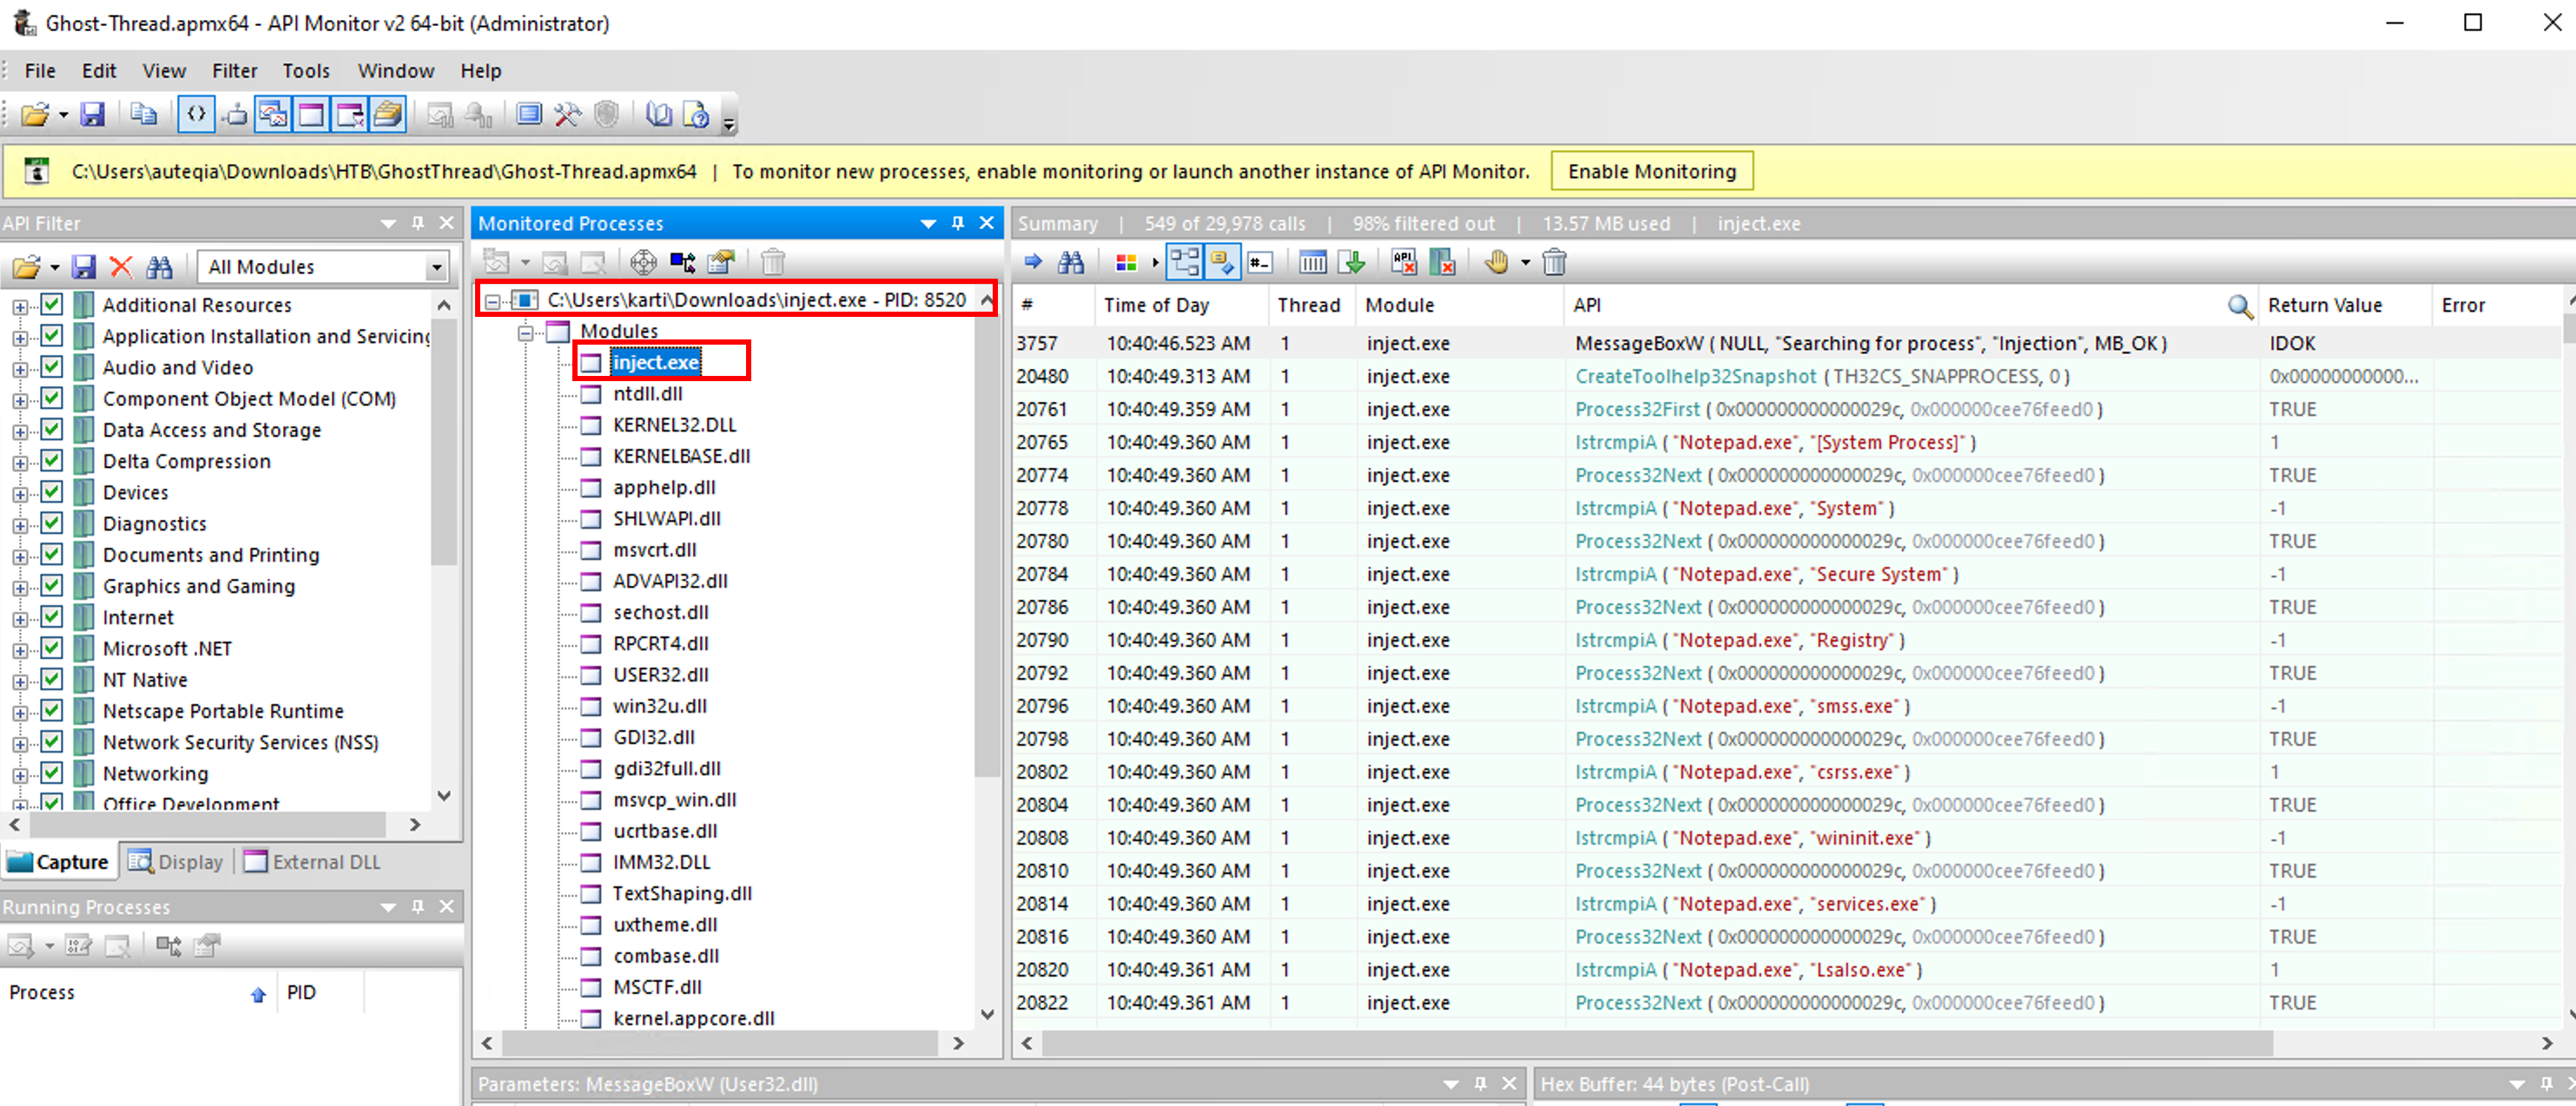
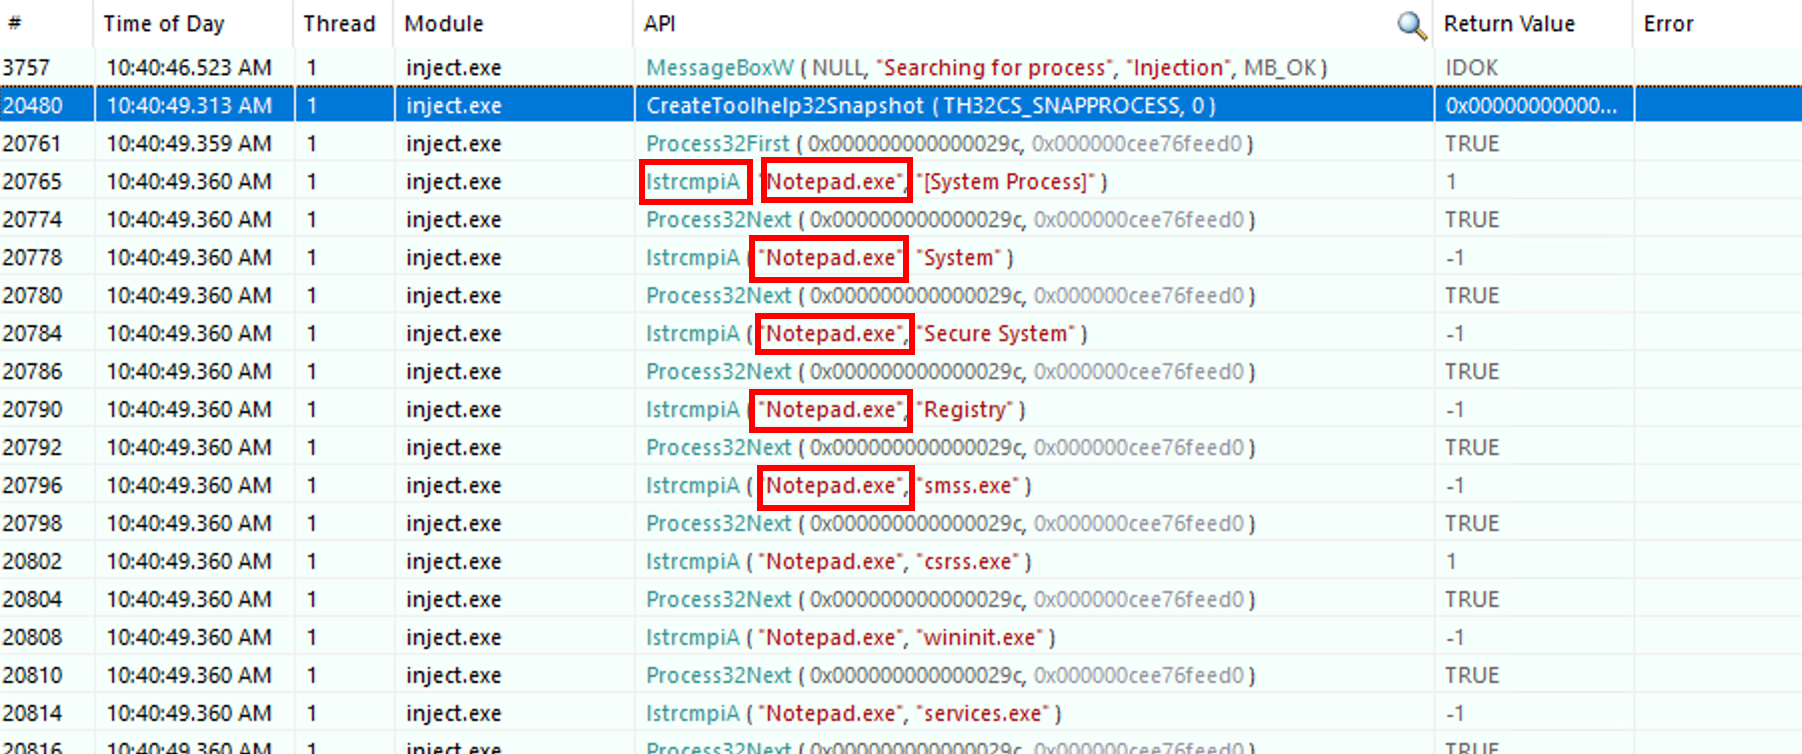
As we can see on the right side of the screenshot, there is many suspicious API calls such as lstrcmpiA ( "Notepad.exe", "msedgewebview2.exe" ) which means that the process is looking for the Notepad.exe string within the running processes. It iterates from process to another by calling the Process32Next API. The Microsoft documentation tells us that the retrieved informations are coming from a system snapshot. As we can see in the screenshot, the CreateToolhelp32Snapshot API is called. It takes a snapshot of the specified processes as well as the heaps, modules, and threads used by these processes. For our case, all the processes were taken into this snapshot based on the first argument TH32CS_SNAPPROCESS.
IDA
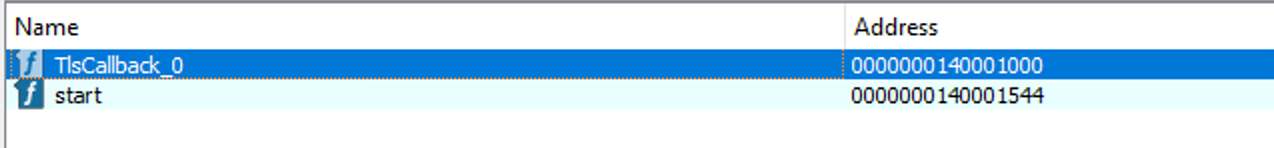
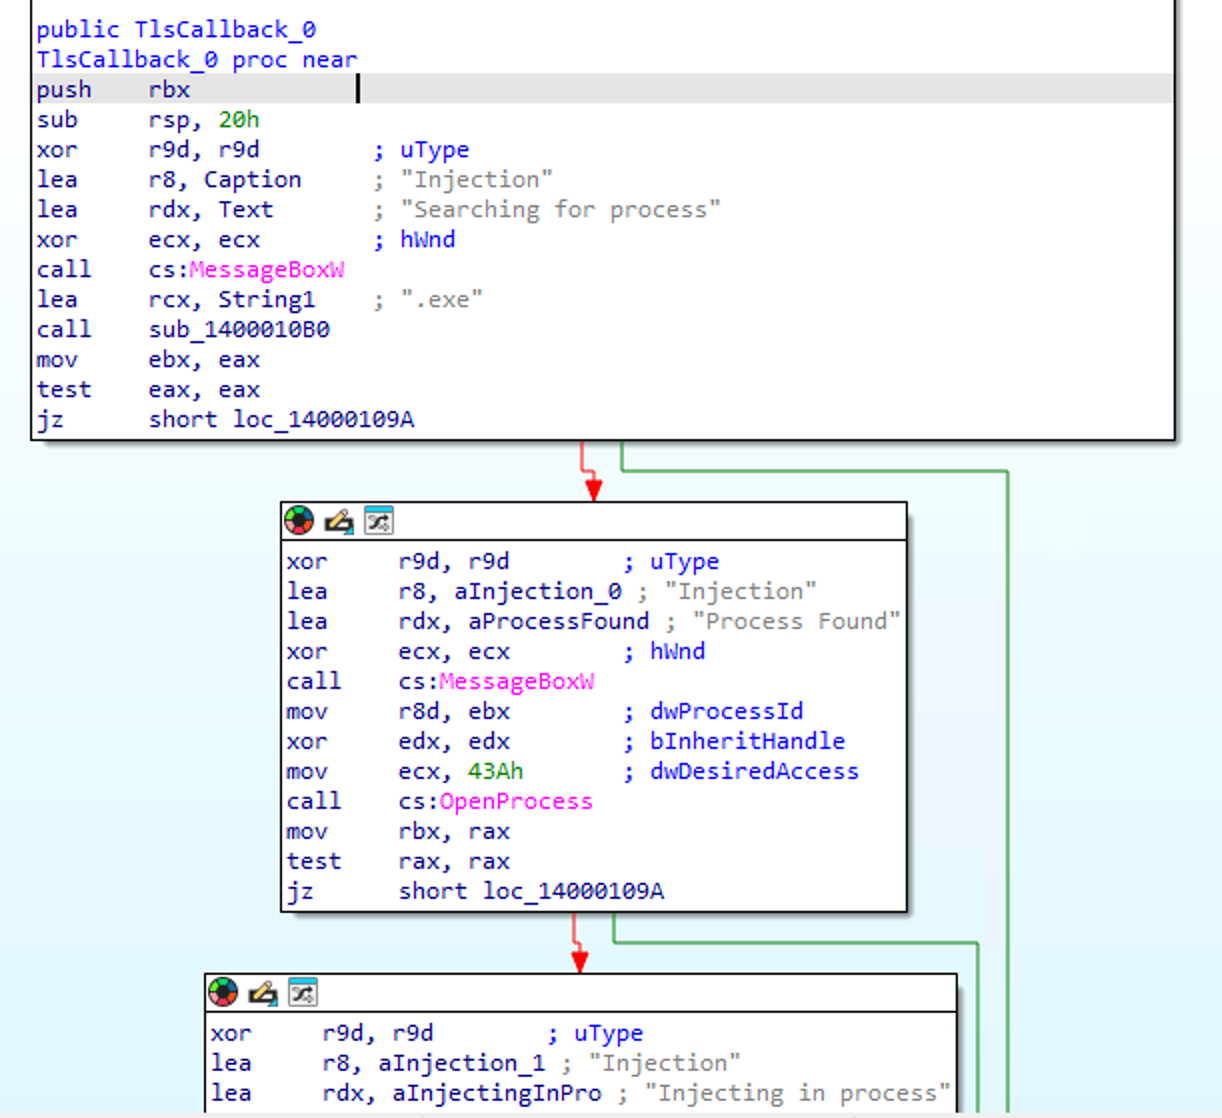
After launching IDA, we can check the Exportd and see that there is a strange little guy named TlsCallback_0.
I didn’t know what was TlsCallback_0 so I checked on the Internet.
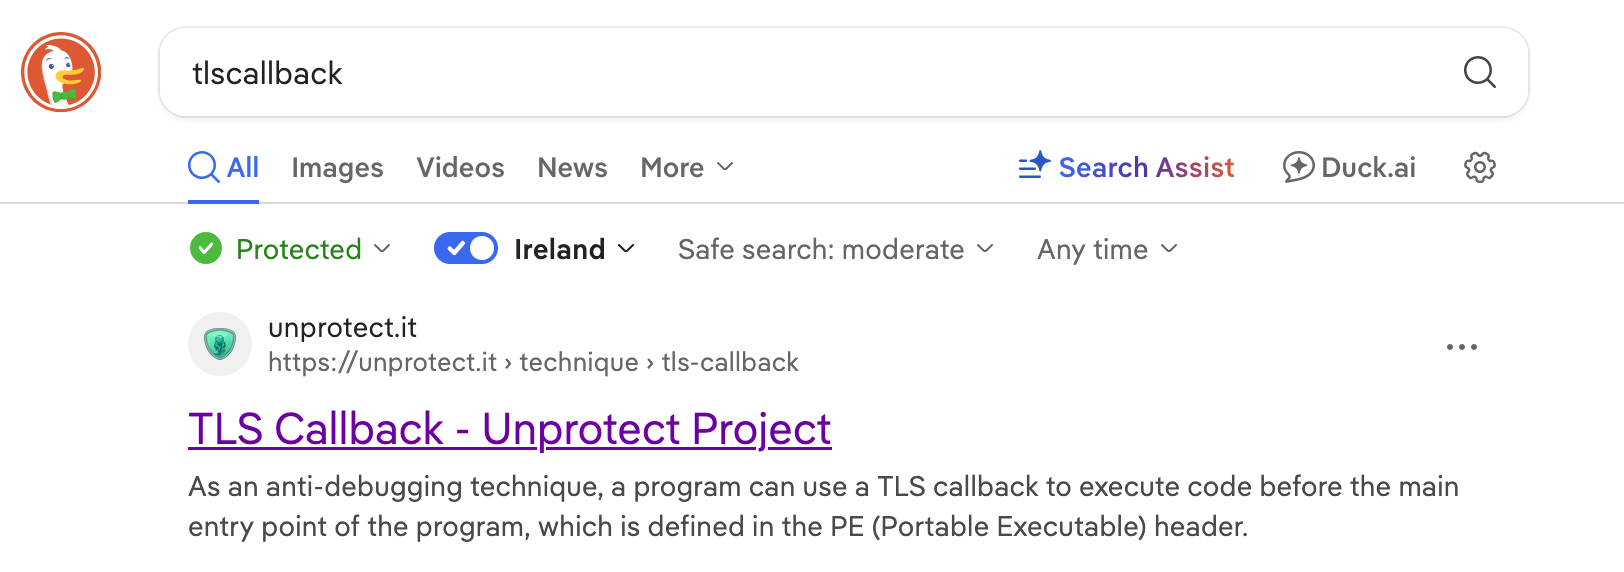
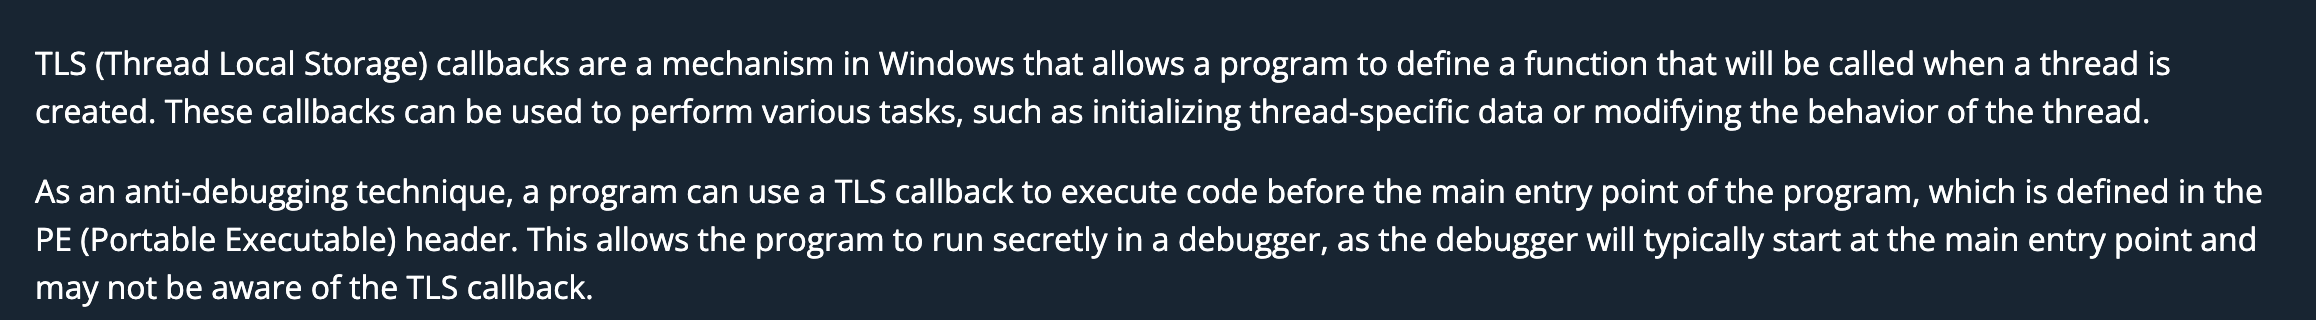
Based on this article, we can determine that TLScallback is a mechanism that serves as anti-debugger technique. It ends the program before reaching the entrypoint (mostly the main).
As we can see in the graph view, the public TlsCallback_0 is called at the very beginning of the flow.
Based upon these informations we harvested, we can answer to almost all the questions.
1. What process injection technique did the attacker use?
As we have seen, the attacker performed a Thread Local Storage process injection described [here](inject malicious code into processes via thread local storage (TLS) callbacks). It manipulates the pointers within a PE to redirect a process to a malicious code before it reaches the entrypoint.
Thread Local Storage
2. Which Win32 API was used to take snapshots of all processes and threads on the system?
The snapshot taken involved the whole running processes at the time. Based on our previous investigation, we can tell that the Win32 API used to achieve this is CreateToolhelp32Snapshot
CreateToolhelp32Snapshot
3. Which process is the attacker’s binary attempting to locate for payload injection?
On the screen below, we can assume that the attacker was seeking the Notepad.exeprocess.
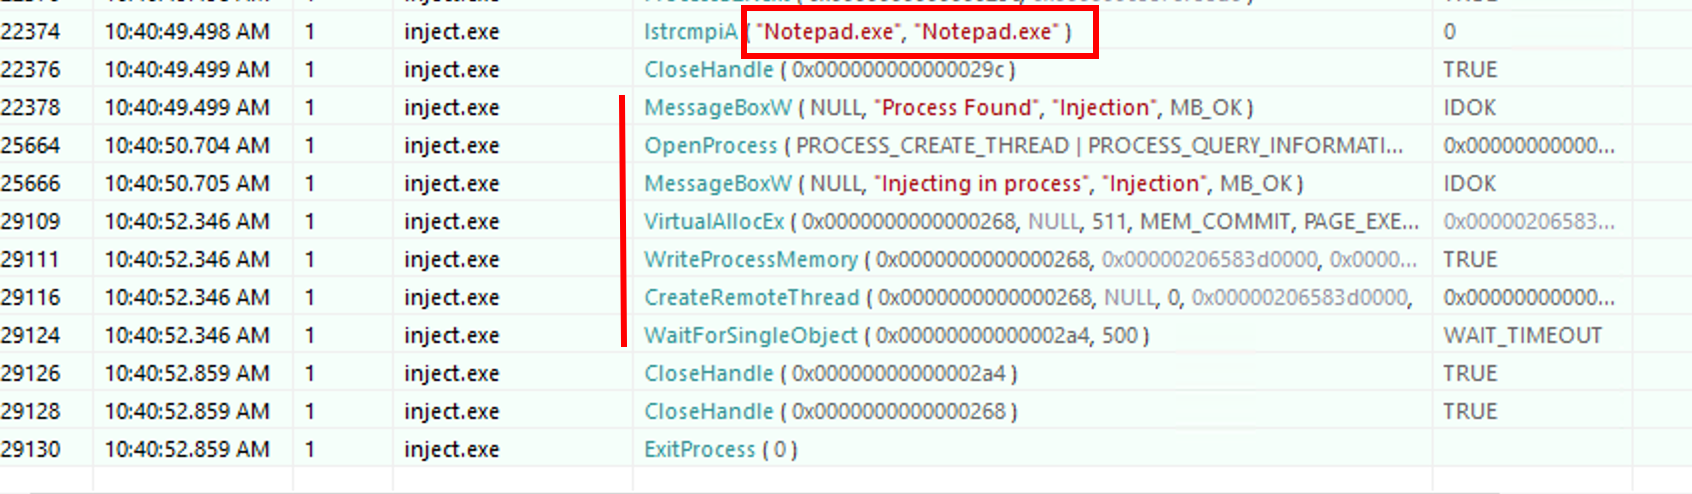
And then, when he found the Notepad.exe crawling through the snapshot, he started the process injection:
Notepad.exe
4. What is the process ID of the identified process?
By clicking on the line that was used to find theNotepad.exe process, we can see the PID (value of th32ProcessID.)
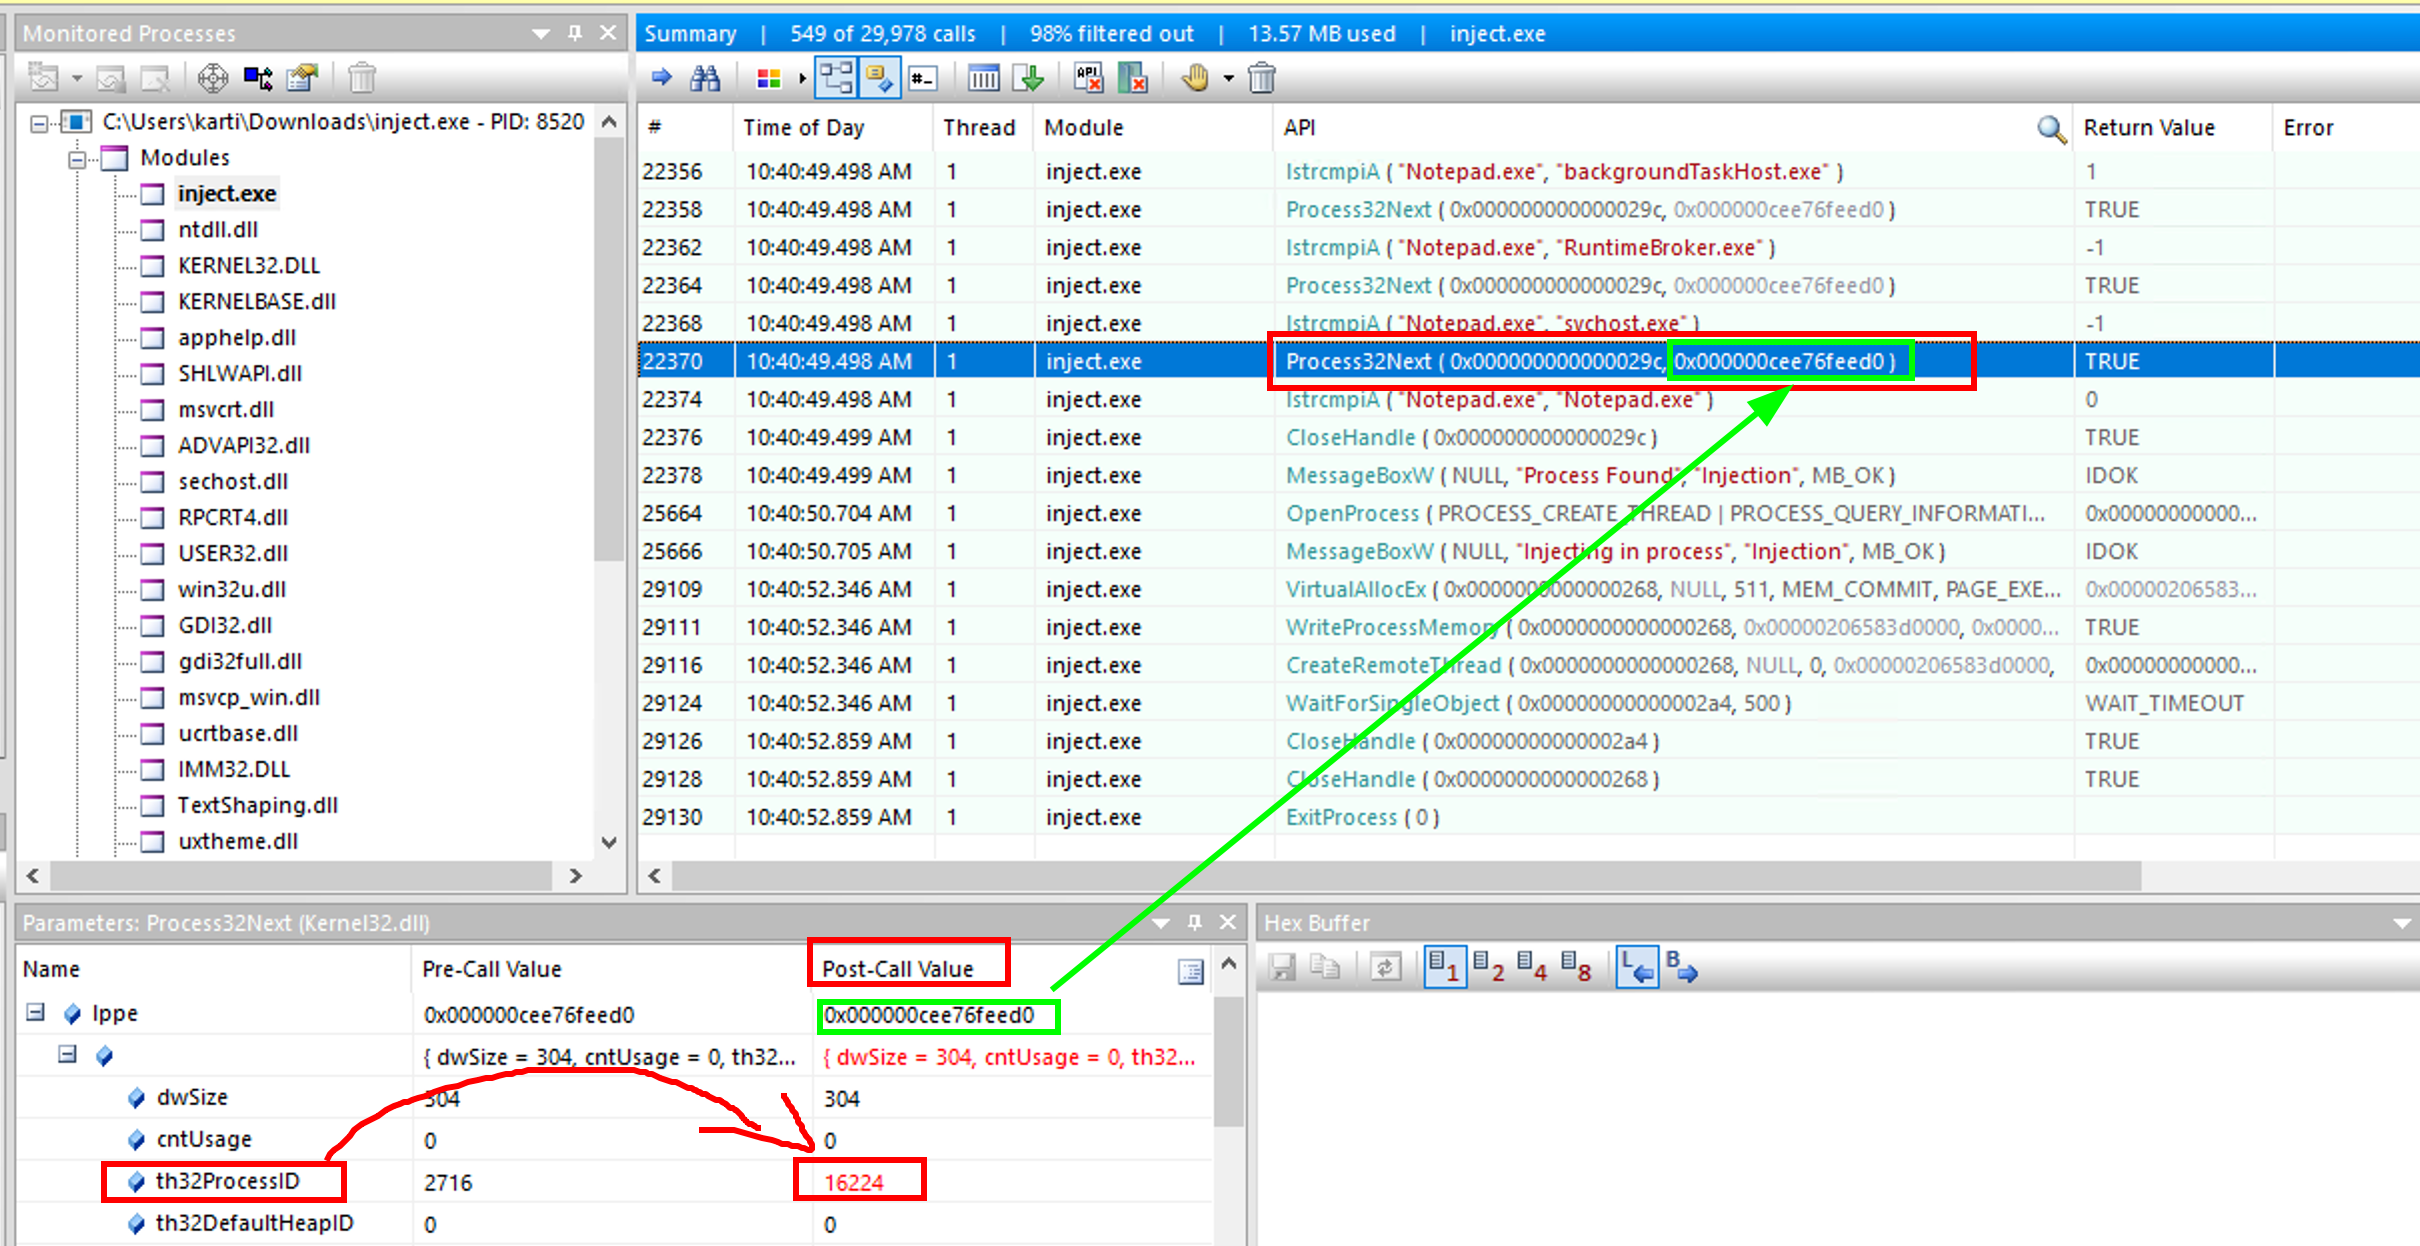
16224
5. What is the size of the shellcode?
Following the “research phase” of the attacker, once he found Notepad.exe, he started to write the shellcode inside the target process. The attacker leveraged the WriteProcessMemory API to do so. Inside the API parameters, we can find the shellcode size: 511
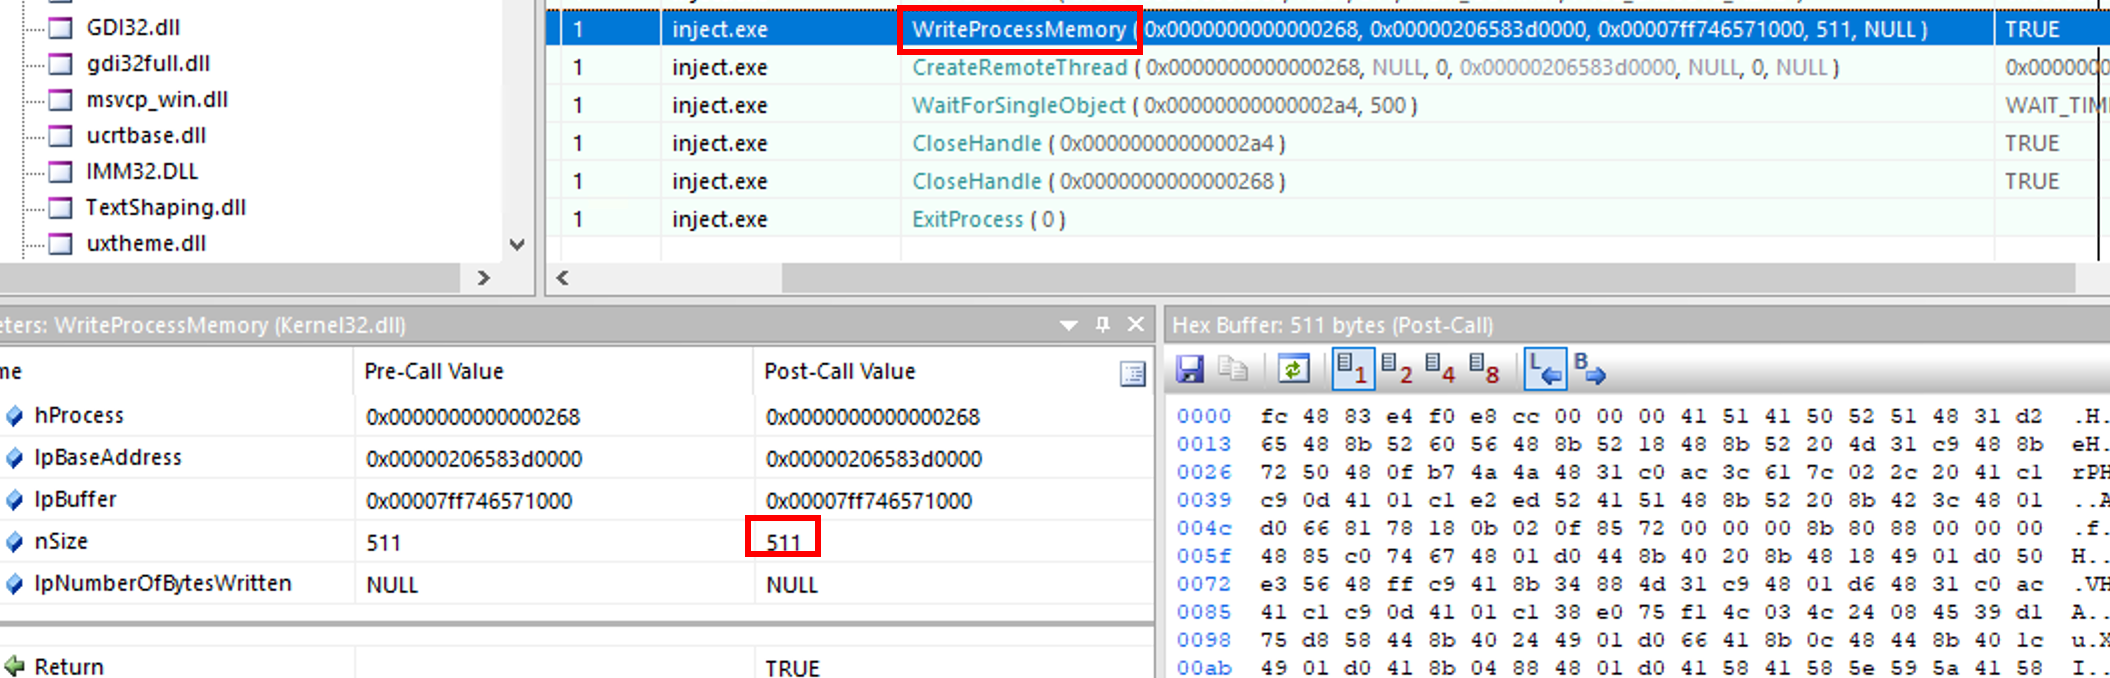
511
6. Which Win32 API was used to execute the injected payload in the identified process?
Just below the WriteProcessMemory, we can see the CreateRemoteThread API call that was used to inject the shellcode inside the Notepad.exe memory.
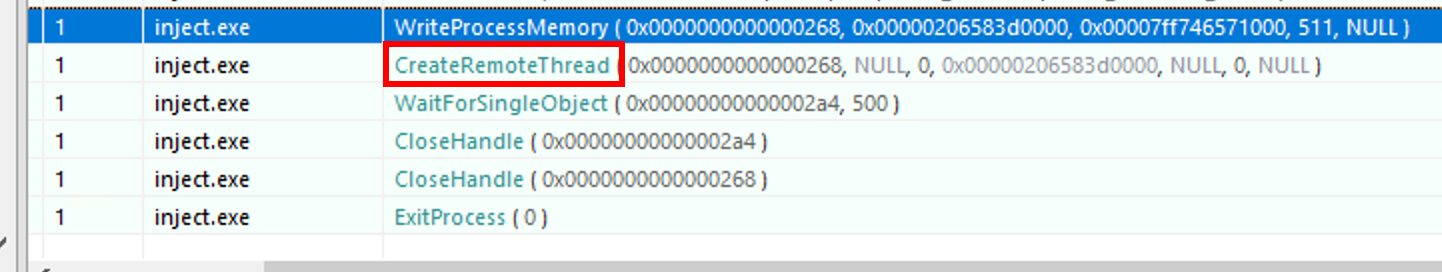
CreateRemoteThread
7. The injection method used by the attacker executes before the main() function is called. Which Win32 API is responsible for terminating the program before main() runs?
To achieved the TLS injection, the attacker exited the process before it reaches the main entrypoint. To do so, he used the common ExitProcess API call.
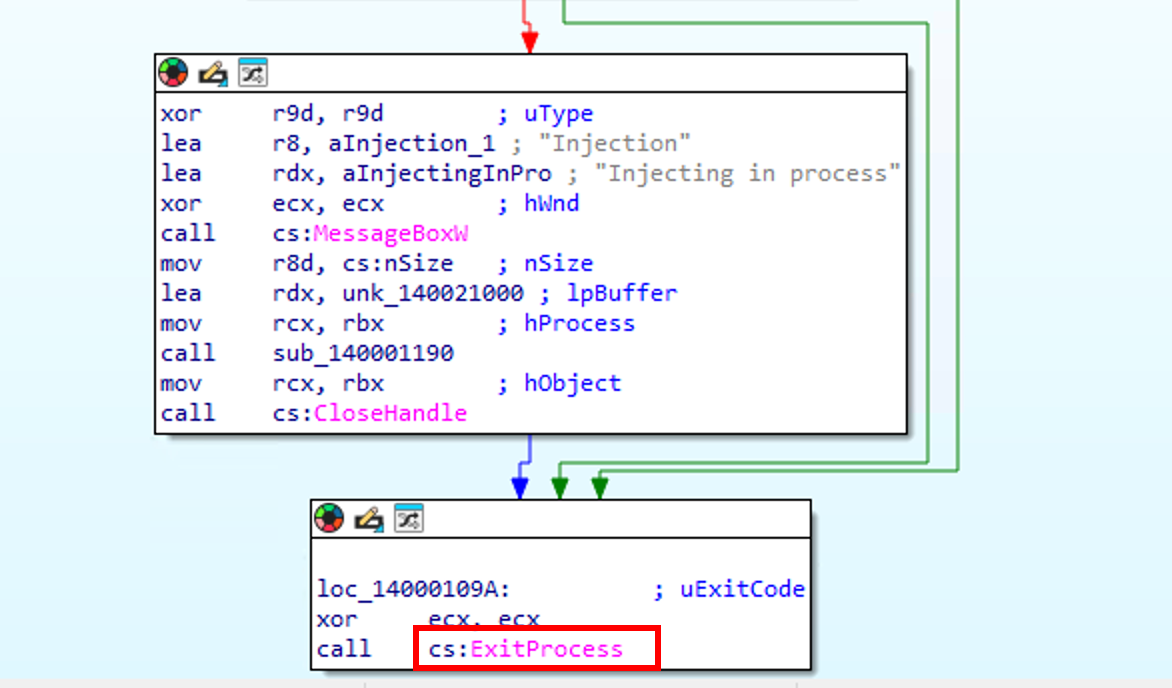
ExitProcess